Volumetric vs Image-Based Cell Counting for CAR-T QC
The method explainer: volumetric vs image-based counting for CAR-T QC, and why the CV gap matters at lot release.
- Volumetric counting measures each particle's physical volume directly — image-based counting infers count and size from a captured image.
- On accuracy, serious instruments run even — a benchtop volumetric analyzer showed no significant difference from a reference volumetric sizer in a peer-reviewed CAR-T QC study, so accuracy will not decide the choice.
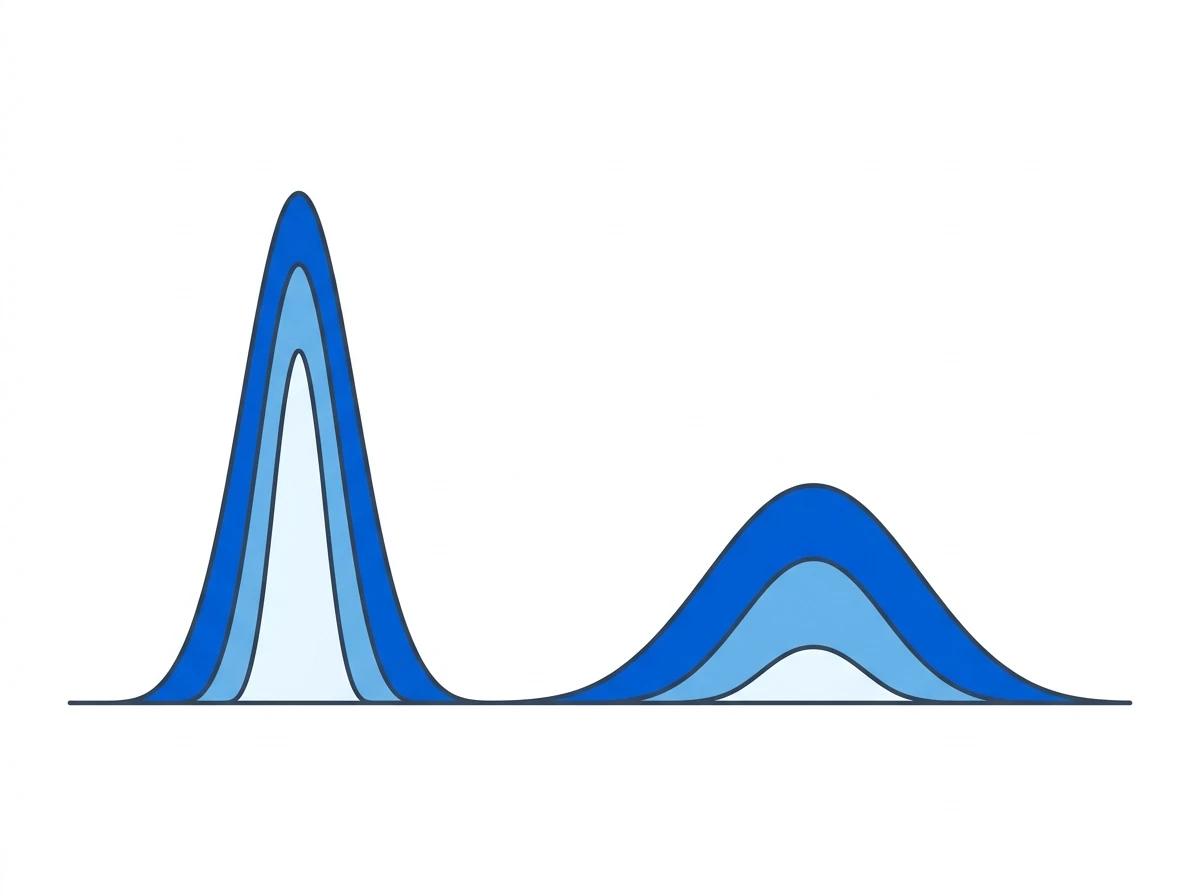
- Precision is where the methods part — a validated volumetric count holds a CV under 2% against 20 to 30 percent for image-based counts, reading up to 40,000 particles per test instead of imaging a few hundred.
- "Accurate enough for release" is settled by precision and provability — not by an accuracy contest between comparable instruments.
Volumetric cell counting measures each particle's physical volume directly. Image-based cell counting infers count and size from a captured brightfield or fluorescence image. For CAR-T QC, the two methods reach comparable accuracy, so the choice turns on precision and on whether you can prove the count.
That choice reflects a larger shift. In GMP cell-therapy manufacturing, the cell count and viability go on the certificate of analysis, so a count can function as a release-grade measurement rather than housekeeping. As what makes a cell count audit-ready lays out, an audit-ready count clears two bars: it has to be accurate, and it has to be one you can prove. Accuracy is the table-stakes bar. The harder half, the one most method comparisons skip, is how volumetric and image-based counting differ once accuracy is settled.
What is the difference between volumetric and image-based cell counting?
Volumetric counting sizes and counts each particle by measuring its physical volume as it passes through a sensing zone, so a cell's size is a direct physical reading. Image-based counting captures a picture of a small sample chamber and uses software to find objects, then infers count and size from what the optics resolve.
The two methods differ in what they depend on. A volumetric reading comes from the particle's actual displacement, not from focus, staining, or how cleanly an algorithm separates two touching cells in an image. An image-based reading depends on image quality and the software's object-calling. That is why it can drift when cells are small, translucent, clumped, or mixed with debris.
Which is more accurate for CAR-T QC, volumetric or image-based?
Comparable. A benchtop volumetric analyzer, the Moxi GO II, showed no significant difference from a reference volumetric sizer for both count and size in a peer-reviewed Penn Medicine CAR-T QC study (Pajarillo et al., Cytotherapy 2024). Between serious instruments, accuracy is not the differentiator. It is the price of entry.
So accuracy will not decide this. What you can prove about the count is the tiebreaker. The more useful question is which method holds a steady number, read after read, on the samples that are hardest to count.
Why does counting precision (CV) matter more than accuracy on cell-therapy samples?
Precision is reproducibility: read the same lot twice, and how close are the two numbers. Reported as a coefficient of variation (CV), it is where the two methods separate. A validated volumetric count holds a CV under 2%. Image-based counts commonly run a CV of 20 to 30 percent on the same class of sample.
That gap widens exactly where cell-therapy samples are toughest to count. Autologous CAR-T lots are often small, the cells can be close in size to debris, and concentrations can run low. Those are the conditions that push an image-based count around. When a lot is size-of-one and the number lands on a certificate of analysis, a wide CV becomes a question you have to answer: why did two reads of the same lot disagree? A tight CV keeps that question from ever reaching your auditor.
How many particles does a volumetric count actually measure?
Up to 40,000 particles per test, in 10 to 15 seconds, each sized by its own physical volume. An image-based counter typically resolves a few hundred particles in the imaged area. That roughly hundred-fold difference in sample size drives the precision gap. A number built from tens of thousands of direct measurements is steadier than one extrapolated from a few hundred imaged objects.
Reading more particles also means a rare or off-size population is more likely to be detected than missed in a small field of view. Volumetric instruments report particles, the physically correct unit here, since the same measurement counts cells, nuclei, beads, and debris alike.
How the two methods compare on the dimensions that decide it
| Dimension | Volumetric counting | Image-based counting |
|---|---|---|
| Measurement principle | Direct physical volume per particle | Count and size inferred from an image |
| Particles per test | Up to 40,000 | ~100 to 300 |
| Validated count CV | Under 2% | ~20 to 30% |
| Strongest on | Small, translucent, debris-heavy, or low-concentration samples | Larger, clean, well-separated cells |
Both methods count accurately. They separate on precision and on the samples they hold up on — which is why the CV row, not the accuracy question, is the one that decides a release-grade count.
Is a benchtop cell analyzer accurate enough for GMP release?
On the evidence, yes. In the Penn Medicine study, a benchtop volumetric analyzer matched a reference volumetric sizer, the method a GMP lab already trusts, with no significant difference in count or size. The accuracy question is settled.
But "accurate enough for release" turns on two things accuracy does not cover: precision, so the number holds read to read, and provability, so the number survives an audit. Precision is the volumetric method's edge. Provability is a separate requirement, the other half of an audit-ready count: native 21 CFR Part 11 data integrity, which what 21 CFR Part 11 requires of a cell counter covers in full. A count can be accurate and precise and still fail an audit if the instrument cannot show who changed the data, and when.
The instrument gives you a research-use count, viability, and identity record you can prove. Your validated method and quality system own the release decision.
Where does a benchtop volumetric analyzer stop?
The same run also reads viability plus one identity marker, a CD4 or CAR read, at the bench in seconds. In the Penn Medicine study, viability tracked a reference fluorescence analyzer at r²=0.97, with CD4 at r²=0.997 and CAR19 at r²=0.90. That is enough to confirm the cells are alive and are the cells you expect, as a routine in-process or release-adjacent check.
It is not a full identity or potency panel. A one- to two-color read does not replace the high-parameter work of a flow cytometry core, and it is not meant to. The benchtop analyzer handles the routine count, viability, and identity confirmation at-line, which frees the core for the panels only it can run. If your primary release assay has to be a full multi-color identity or potency panel, that stays core-facility work, and you will know that quickly.
Choosing between the methods
At release, the number you can stand behind is the one that is both precise and provable. Score any counter against both bars on your own samples, then plan the evaluation against the reference method you already run.